Debug Unreal Engine Python using PyCharm
If you are using Unreal Engine Python you might want to debug your program without putting print() everywhere.
Here is what I use to debug Unreal Engine python code from PyCharm.
-
Configure your python interpreter
Add a new python interpreter : https://www.jetbrains.com/help/pycharm/configuring-python-interpreter.html#add_new_project_interpreter
If you use the embedded python interpreted, it should be located here
Engine\Plugins\UnrealEnginePython\Binaries\Win64\python.exe -
Create a remote debug configuration
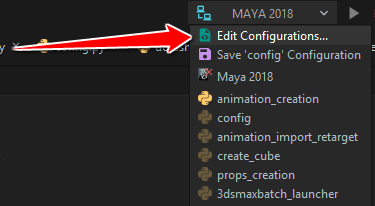
On the run/debug configuration selector, select
Edit Configurations...
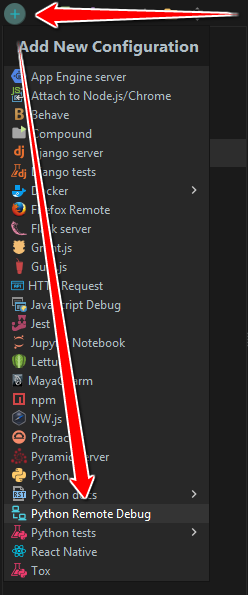
Create a new configuration by clicking the
+button andPython Remote Debug.
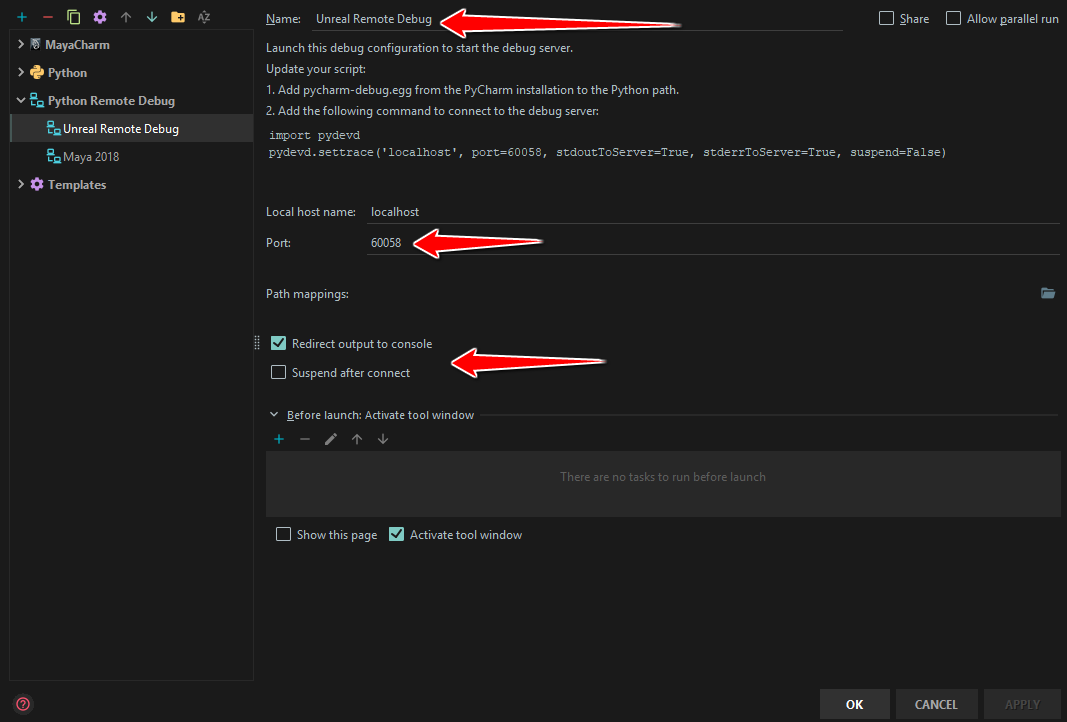
Setup your configuration by giving it a name, choose a port (for example
60058), checkRedirect output to consoleand uncheckSuspend after connect. Then, clickOK.
-
Launch the debug configuration in PyCharm
Select your debug configuration on the Run/Debug configuration selector on the top right of the window.

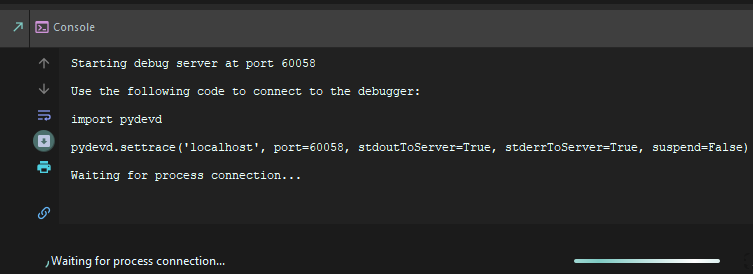
Click the bug icon to launch the remote debugging
 . It will wait for a remote connection.
-
Attach to the debugger in Unreal
Execute the following code from the Unreal Engine Python editor.
You’ll have to change the
pydev_pathvariable and use your ownpydevdirectory from your PyCharm installation.import sys def attach_to_debugger(host, port): try: # TODO : Use your PyCharm install directory. pydev_path = "D:/PyCharm/PyCharm 2018.3.4/helpers/pydev" if not pydev_path in sys.path: sys.path.append(pydev_path) import pydevd pydevd.stoptrace() pydevd.settrace( port=port, host=host, stdoutToServer=True, stderrToServer=True, overwrite_prev_trace=True, suspend=False, trace_only_current_thread=False, patch_multiprocessing=False, ) print("PyCharm Remote Debug enabled on %s:%s." % (host,port)) except: import traceback traceback.print_exc() attach_to_debugger('localhost', 60058)If you don’t want to execute this code every time you need to debug you application, you can call it from the
ue_site.pyfile, but watch out,pydevd.settrace()will freeze the engine until you launch your remote debug configuration from PyCharm. -
That should be it !
Put some breakpoints in PyCharm and they should break when the code is executed.
Sadly, despite having access to the content of your standard variables (list, dict…), you won’t be able to get the content of
unreal_engine.UObjectand other Unreal related objects.
If you are using VSCode, take a look at the Remote Debugging documentation of the Python extension. Unfortunately, the last time I tried it, I couldn’t manage to hit the breakpoints since they were Unverified (greyed out).

Laisser un commentaire